Case study
Commit City
I had a pretty simple idea: GitHub gives us this little grid of green squares, but what would that history look like if it felt like an actual place?
What it is
Give it a public GitHub username and it turns a year of contribution history into a 3D cyber-city. Each day becomes a city lot. More activity means taller buildings. Quiet days stay low and dark, so the original contribution graph is still there underneath everything.
Demo
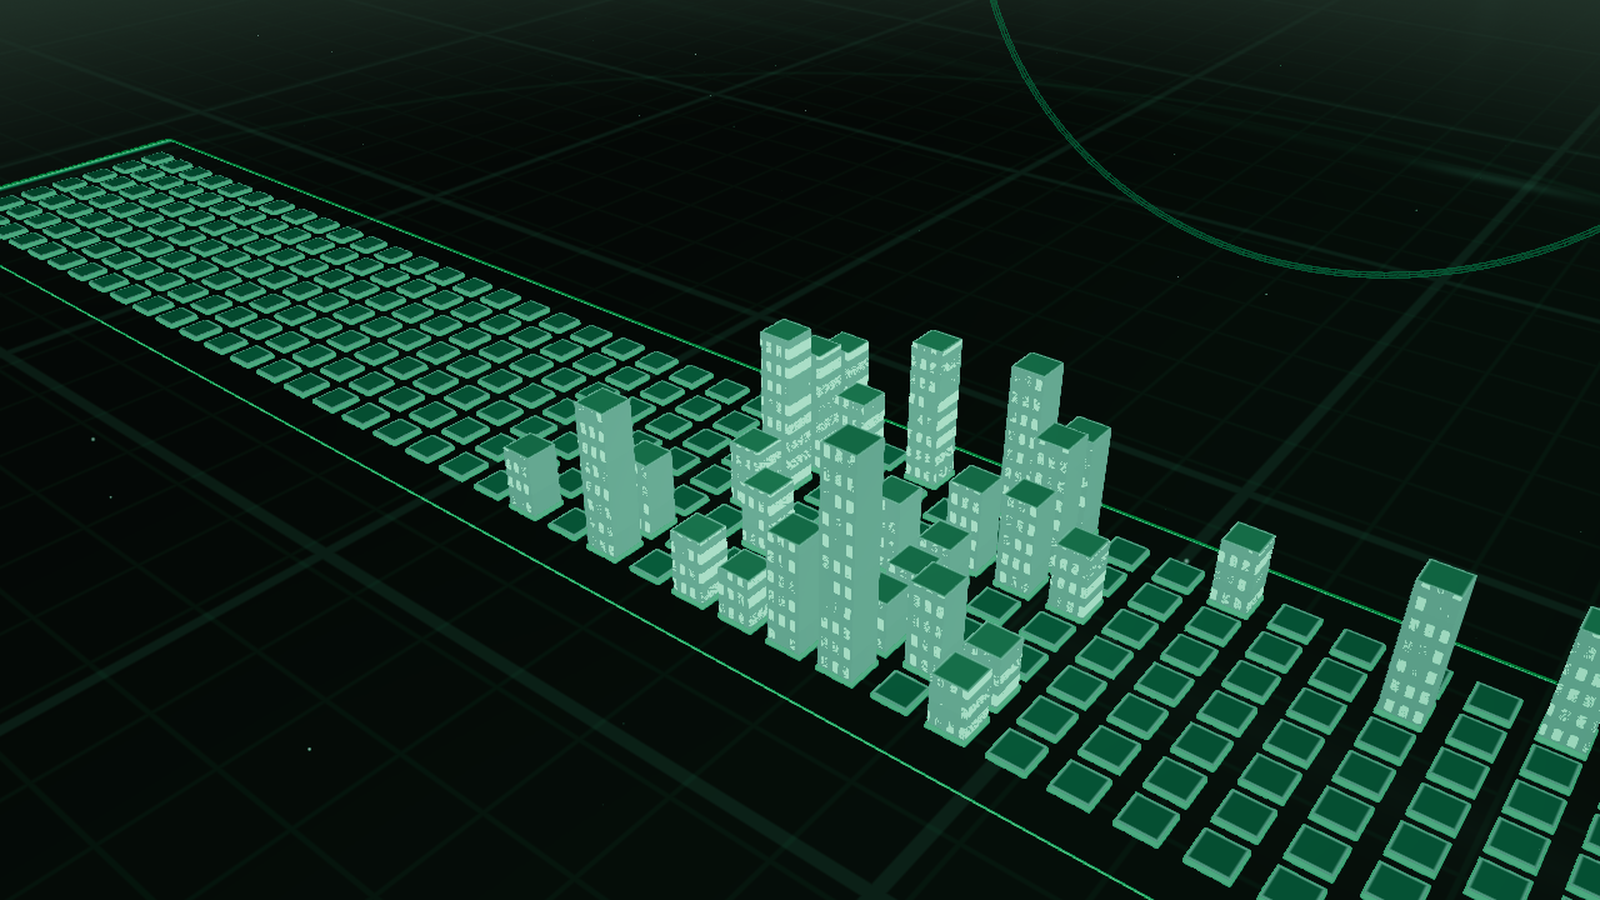
docs/commit-city-hero.png). The README captions it as the cyb3rcricket contribution skyline.docs/commit-city-demo.webm. Watch the silent 20s demo (WebM)How it works
The browser does not talk to GitHub directly. It calls a small server endpoint, GET /api/contributions?user=USERNAME. The README’s resolution order is: GitHub’s GraphQL API when a server-side GITHUB_TOKEN is set, GitHub’s public contribution-calendar HTML when it is not, and deterministic mock data during local development if GitHub is unavailable. The token stays out of client-side JavaScript. The public demo runs on Vercel. GITHUB_TOKEN is a server-side Production variable, USE_MOCK stays unset there, and the function is api/contributions.ts.
What comes back is a year window plus a days array: date, contribution count, level, and grid indices, along with username, totalContributions, and source of github or mock. assignGrid places those days on a Sunday-based week grid, with a weekIndex and a dayIndex.
The skyline is instanced boxes. heightForCount keeps a day with no contributions at a short foundation, 0.08. Days with commits scale from 0.22 to 5.4, using the square root of that day’s count against a robust max: the count at 96% of the way through the sorted list of days that actually have commits. One huge day does not flatten the rest of the year. footprintForLevel widens a lot slightly as the level goes from 0 to 4 (0.82 + level * 0.035). Fog, bloom, and particles add depth. The rule in the README is the one worth keeping: the towers are still the data.
A city can be shared as /?user=USERNAME or /u/USERNAME. The second path is a Vercel rewrite back to index.html. Inside the app, Capture Skyline saves a still.
The deploy bug
On September 14, 2026, the production API failed on Vercel. The fix is the commit fix(api): add .js extensions for Vercel ESM resolution. Its message says the serverless function threw ERR_MODULE_NOT_FOUND for extensionless relative imports under Node ESM.
package.json already had "type": "module". The TypeScript files that run the API were importing each other the way a bundler allows, with no file extension: from "../server/handler". Node’s ESM loader does not fill in .js for you. On Vercel those files are loaded as ESM, so the lookup failed.
The diff adds a .js suffix on the relative imports in the runtime graph: api/contributions.ts, server/github.ts, server/handler.ts, server/mockData.ts, and shared/calendar.ts (including shared/calendar.ts importing ./types.js). The commit message says that was checked with 40/40 tests, a production build, and a live API response whose source was github. That check is the commit’s, not a suite I re-ran for this page.
Shipping polish
Later the same day, docs(social): wire absolute OG and Twitter preview tags filled in the tags a shared link needs if the preview is going to show a picture. index.html already had og:title (“Commit City”), og:description (“See what you've built. Turn GitHub history into a skyline.”), og:type of website, and twitter:card set to summary_large_image. It did not have a page URL or an image.
The commit points og:image and twitter:image at https://commit-city-psi.vercel.app/og-image.png, with og:image:width 1200 and og:image:height 630, and sets og:url to https://commit-city-psi.vercel.app/. The title becomes “Commit City — Turn your GitHub history into a skyline”, matching the document title. The Open Graph and Twitter descriptions become “Enter a GitHub username and turn a year of contributions into a living 3D cyber-city.” The page’s own meta description still says “3D city”, without “cyber-”. I have not checked how a particular site renders that card.
What I learned
The skyline can look good while the API underneath it is broken. The deploy bug is a useful reminder to check the whole thing: the public page, the server response, and whether the data actually comes from GitHub. A local build is one piece of that check.
The towers are still someone’s contribution history. One huge day should not flatten the rest of the year, and the dates and counts need to stay available. I want someone opening this cold to understand what they’re looking at without needing me standing beside them.